Gold Holding Well Above 1775
Baca artikel di situs FBS
Gold Daily Chart
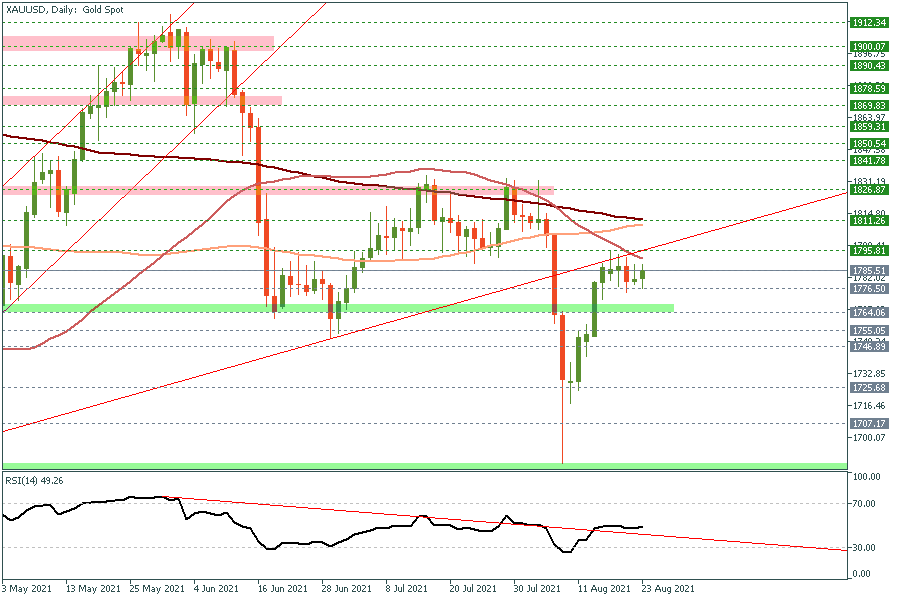
Throughout last week’s trading, gold traded within a tight range, but it also managed to hold well above its 1775 support area until the end of the week, while the technical indicators has improved over the past few days, including the RSI indicator, which is now trading above the 50 mid-point and broke its daily down trendline, which support our medium-term long positions, the one issued few weeks ago at 1730. With that being said, it would be wise to move our stop loss for this week to 1765 USD/Oz to protect some of the profit, while further stabilization above 1775 may clear the way for another test of 1800 USD/Oz in the coming days.
| S3 | S2 | S1 | Pivor | R1 | R2 | R3 |
| 1762.71 | 1772.70 | 1776.91 | 1782.69 | 1786.90 | 1792.68 | 1802.67 |