Key Moment for the Oil Market
Oil prices fell to a three-month low following the release of US inflation data which was in line with expectations. The annual inflation rate of 6% and monthly rate of 0.4% were unsurprising, but the monthly core Consumer Price Index (CPI) beat expectations at 0.5%. This has led to the market pricing in a 25 basis point hike from the Federal Reserve next week after briefly considering a pause in the aftermath of the recent bank failures of Silvergate Corp., SVB Financial, and Signature Bank.
The market is now viewing the Federal Reserve as hawkish again, which has raised concerns about a potential recession, given that the tightening cycle is yet to play out. We hope to gain more insight into the Fed's inclination at next week's Federal Open Market Committee (FOMC) meeting. Still, the market remains uncertain and anxious about the economy's future. Having said all this, let's now look at the technical side of things.
XBRUSD
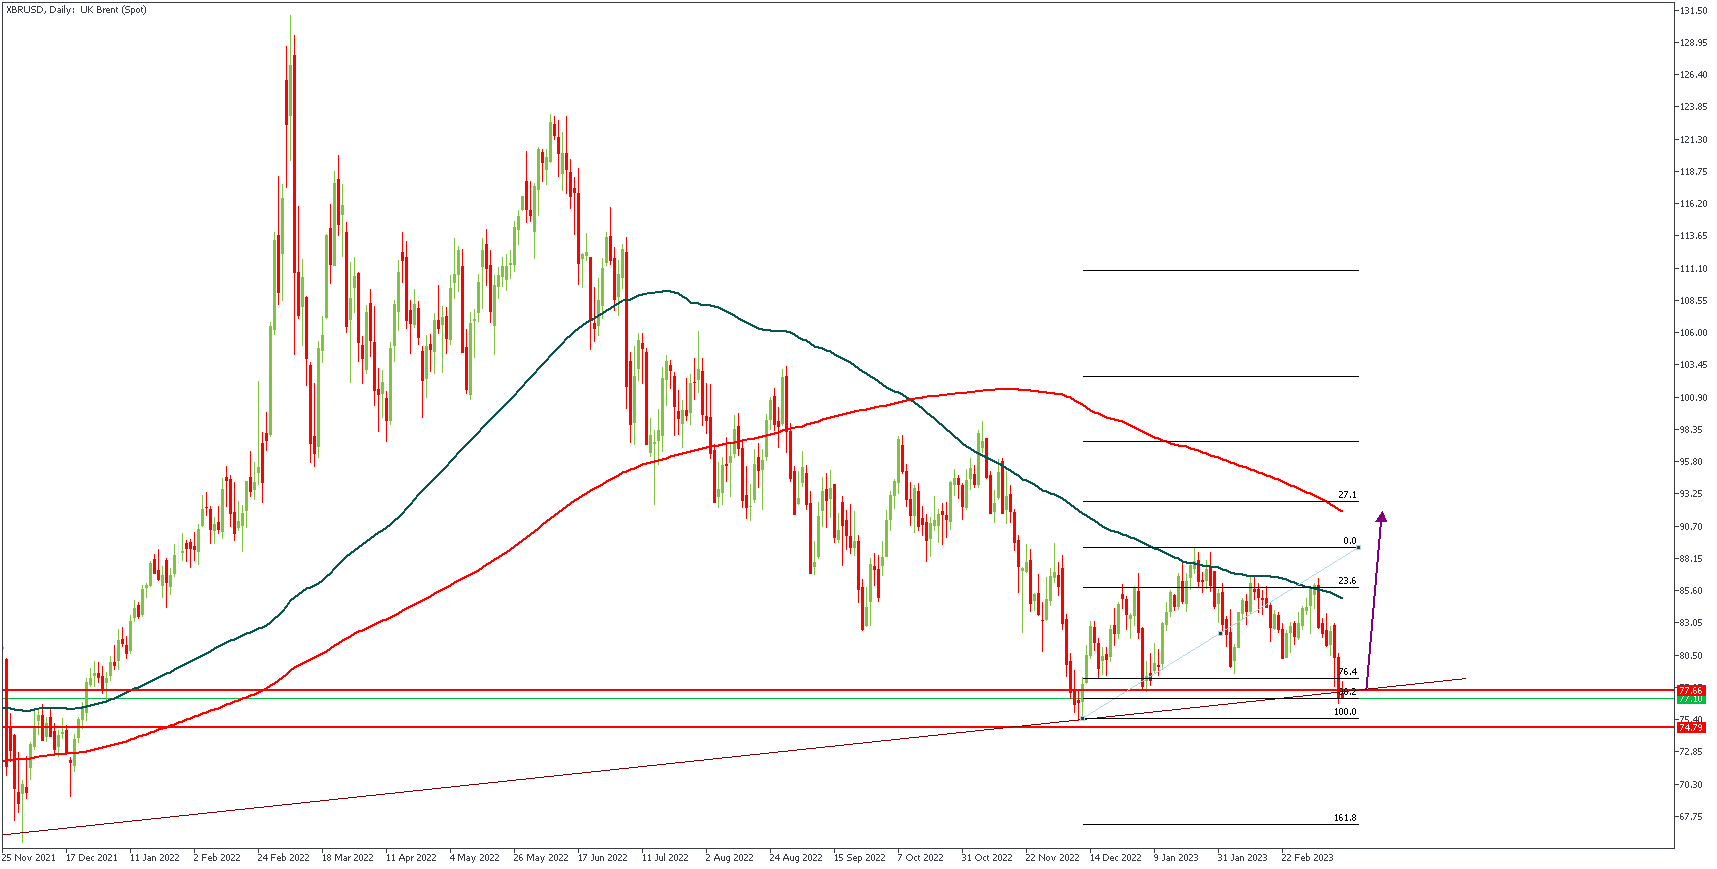
XBRUSD on the Daily timeframe is currently squeezing between the support trendline from 4 years ago and the 100-day MA. Note that the price is currently stalling around 88% of the Fibonacci retracement, which may indicate bullish intent. However, there remains a bit of uncertainty as the MAs are still poised in a bearish array.
Analysts’ Expectations:
Direction: Bullish
Target: 85.55
Invalidation: 74.82
CONCLUSION
The trading of CFDs comes at a risk. Thus, to succeed, you have to manage risks properly. To avoid costly mistakes while you look to trade these opportunities, be sure to do your due diligence and manage your risk appropriately.
You can access more of such trade ideas and prompt market updates on the telegram channel.