What Is Stochastic Oscillator?
The stochastic oscillator developed by George C. Lane at the end of the 1950s is a valuable trading tool for predicting trend reversals. This indicator identifies overbought and oversold levels of security by measuring price momentum, which is the rate of acceleration in price movement.
The idea behind the stochastic oscillator is that the momentum often changes before the price changes direction. As a result, this indicator can outpace the price movement, giving traders an advantage.
The stochastic oscillator is a helpful tool for experienced and novice traders. Combined with other technical analysis tools such as moving averages, trendlines, and support and resistance levels, the stochastic oscillator can be a powerful instrument to improve trading accuracy and identify the best entry and exit points.
How Does Stochastic Oscillator Work?
The indicator measures the recent price close in relation to the highest and the lowest point of the range the security traded in over a defined number of past periods. The standard number of periods used for measurement is 14. For example, on a daily chart, this will be 14 days. On an hourly chart, this will be 14 hours, etc.
The stochastic indicator is a two-line indicator that traders can use on any chart. These two lines are %K and %D lines, which move between 0 and 100.
- When the stochastic indicator is high, the instrument’s price closes near the top of the 14-period range.
- On the contrary, when the indicator is low, the price closes near the bottom of the 14-period range.
- The general rule for the stochastic indicator is that in an upward-trending
market, prices will close near the high. In contrast, prices will close near the low in a downward-trending market. If the closing price slips away from the high in a bull market or the low in a bear market, momentum is slowing, and a reversal might begin soon.
Stochastic Oscillator Formula
The stochastic oscillator formula is:
%K = (Current Close - Lowest Low)/(Highest High - Lowest Low) * 100;
%D = 3-day SMA of %K.
Where:
- "Current Close" represents the security's closing price for the current period;
- "Lowest Low" is the lowest price the security has reached over the specified period;
- "Highest High" is the highest price the security has reached over the specified period.
%K is the fast stochastic indicator, as it reacts more quickly to price changes. %D is the "slow" stochastic indicator, as it is usually a 3-period moving average of %K.
Stochastic Indicator Settings
The Stochastic oscillator is a default instrument of MetaTrader 4 and MetaTrader 5. You can add it to the chart by clicking “Insert” – “Indicators” – “Oscillators” and then choosing “Stochastic Oscillator.”

The default settings are 5, 3, 3. Other commonly used settings for Stochastic include 14, 3, 3, and 21, 5, 5. Stochastic is often referred to as Fast Stochastic with a setting of 5, 4, Slow Stochastic with a setting of 14, 3, and Full Stochastic with a setting of 14, 3, 3.
Fast Stochastic responds more quickly to market price changes, while Slow Stochastic reduces the number of false crossovers and thus filters out some false signals. It’s up to you to choose the parameters you want.
Reading Stochastic Indicator
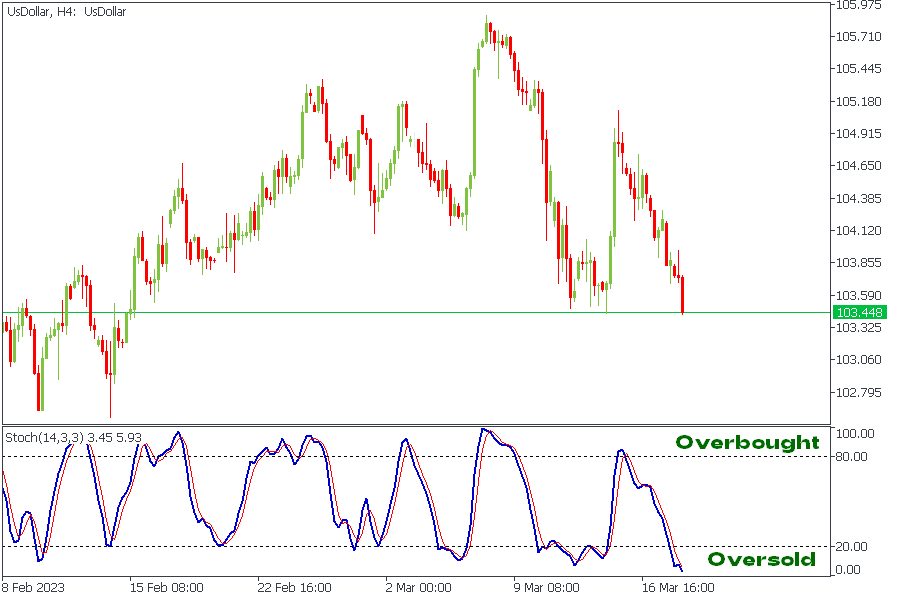
As we mentioned above, a Stochastic oscillator moves between 0 and 100. However, the price usually doesn't reach these extremes. Thus, traders typically use 20 and 80 levels as marks for overbought and oversold areas.
If an indicator rises above 80, the instrument trades near the top of its high-low range and is currently overbought. Vice versa, if an indicator falls below 20, the instrument trades near the bottom of its high-low range and is currently oversold. Usually, when a price reaches overbought and oversold areas, a reversal is about to happen.
If the oscillator moves above 50, the instrument trades within the upper portion of the trading range, with bulls dominating the market. On the contrary, if the oscillator moves below 50, the instrument trades in the lower portion of the trading range, with bears dominating the market.
Overbought and oversold levels are useful for predicting trend reversals.
How to trade with Stochastic Oscillator
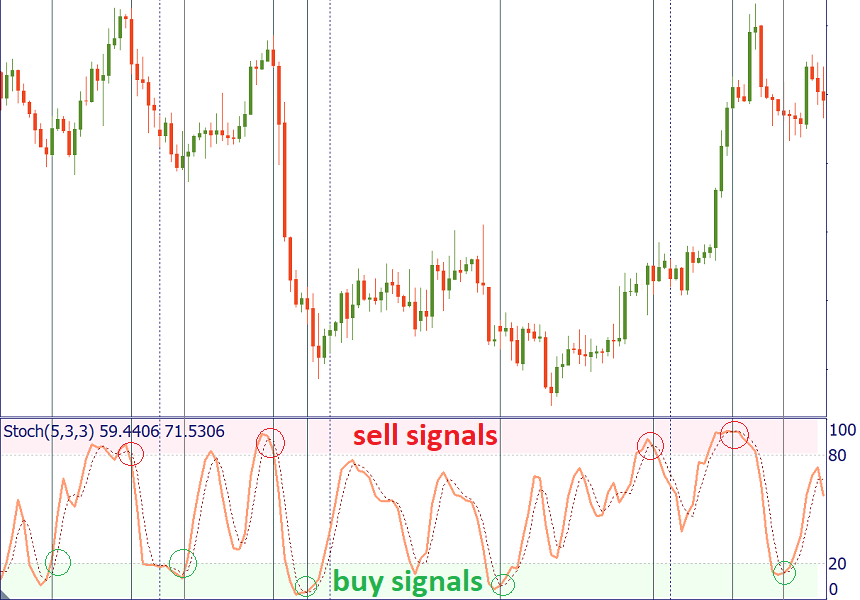
Like any other indicator, Stochastic doesn’t give signals that are 100% profitable. There are two ways to make the signals of this indicator more precise:
Use the signals generated when the crossover happens in the extreme area (above 80 for the sell signal and below 20 for the buy signal).
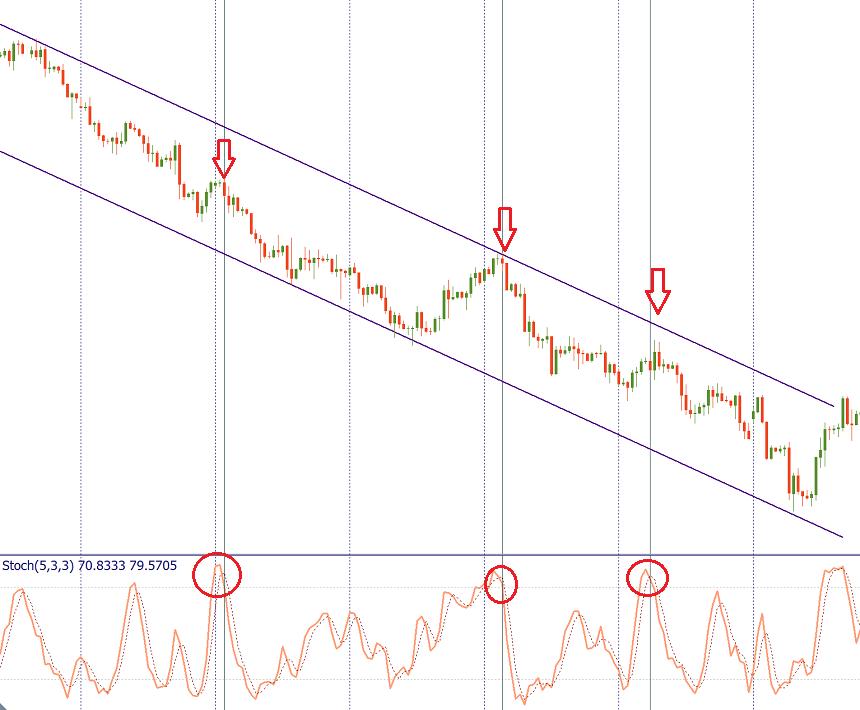
Consider the trend on a larger timeframe and trade in line with it. For example, if you use Stochastic on H1, check the trend on H4. If there’s a strong downtrend, don’t take the buy signals, as the price may stay in the overbought area for extended periods. Instead, focus on the sell signals generated by Stochastics, and you will benefit from trend trading.
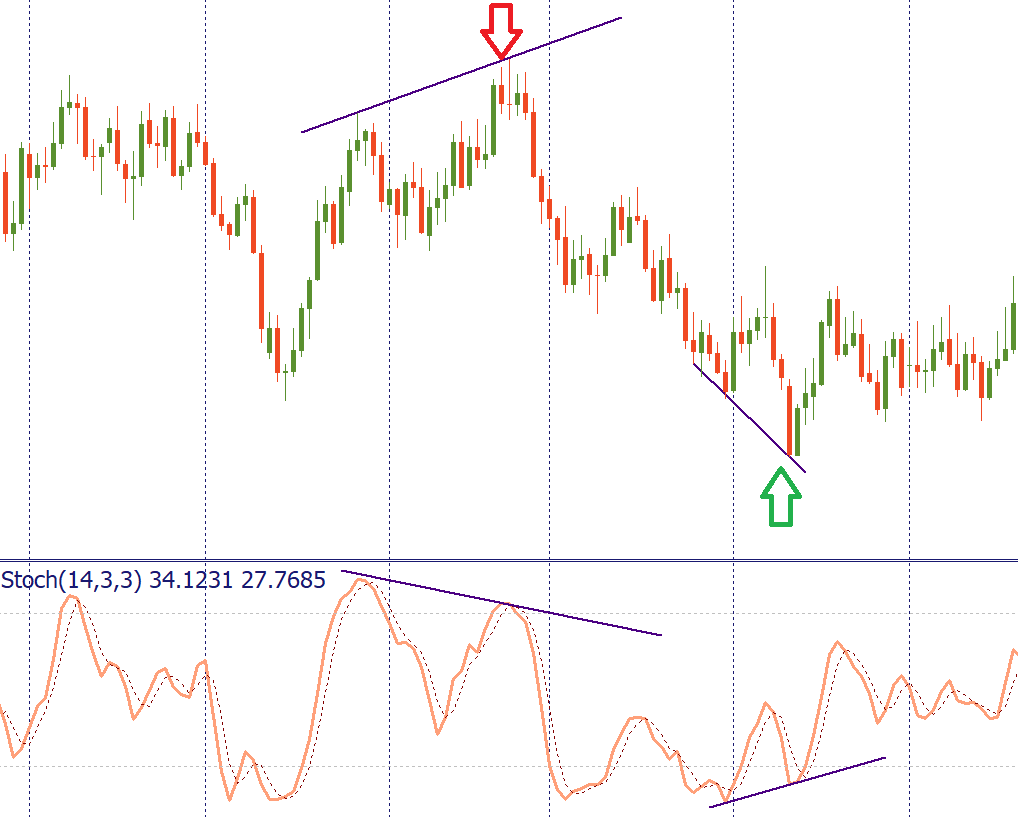
In addition, as with other oscillators, pay attention to the situations when the Stochastic Oscillator forms a divergence from the price chart. A sell signal occurs when the price makes a higher high but the Stochastic forms a lower high (bearish divergence). On the contrary, a buy signal appears when the price makes a lower low, while Stochastic forms a higher low.
It’s also recommended to use the Stochastic Oscillator combined with other technical analysis tools, such as Moving Averages, Heiken Ashi, Alligator, etc.
Summary
A stochastic oscillator is a powerful tool for traders that helps to identify potential market reversals and momentum shifts. You can gain an edge in the markets by understanding how it works and how to use it in your trading strategy. However, it's important to remember that no technical indicator is foolproof, and managing your risk and trade with discipline is always important.