Want to know more about forex? Curious how it works and how to make money trading currencies? This article is for you. Learn all about the pros and cons of trading, potential risks, and the best strategies for growing your wealth. Set off on your trading journey now!
What is the forex market?
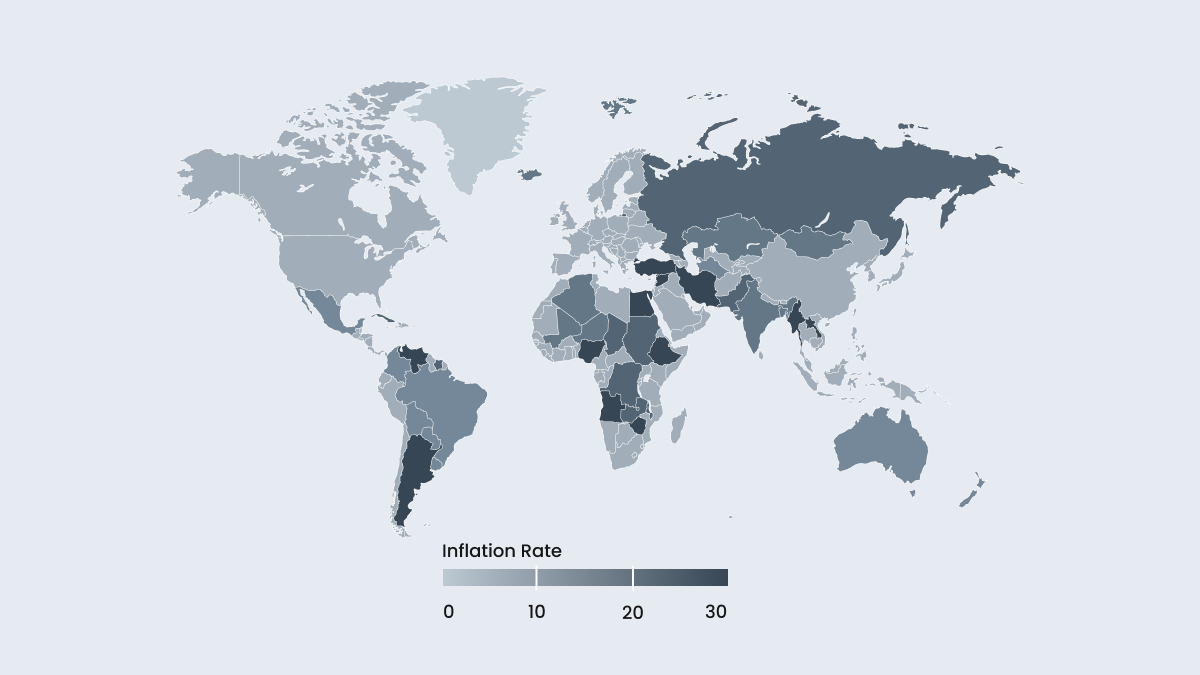
Forex (or simply FX) is short for foreign exchange. World currencies are volatile, and their exchange rates change constantly. Forex traders use these price movements to make profit by selling one currency and buying another at strategic times.
Recent statistics show the forex market developing rapidly. In 2023, the market was valued at a record $805 billion. IMARC Group experts predict that it will increase to $1.5 billion by 2031.
The forex market continues to exhibit rapid growth thanks to the following trends:
new technological advancements like algorithmic trading;
regulatory developments that make the market more transparent;
the increase in retail participation.
Go to FBS Academy to learn more about currency exchange.
What is Forex in simple words?
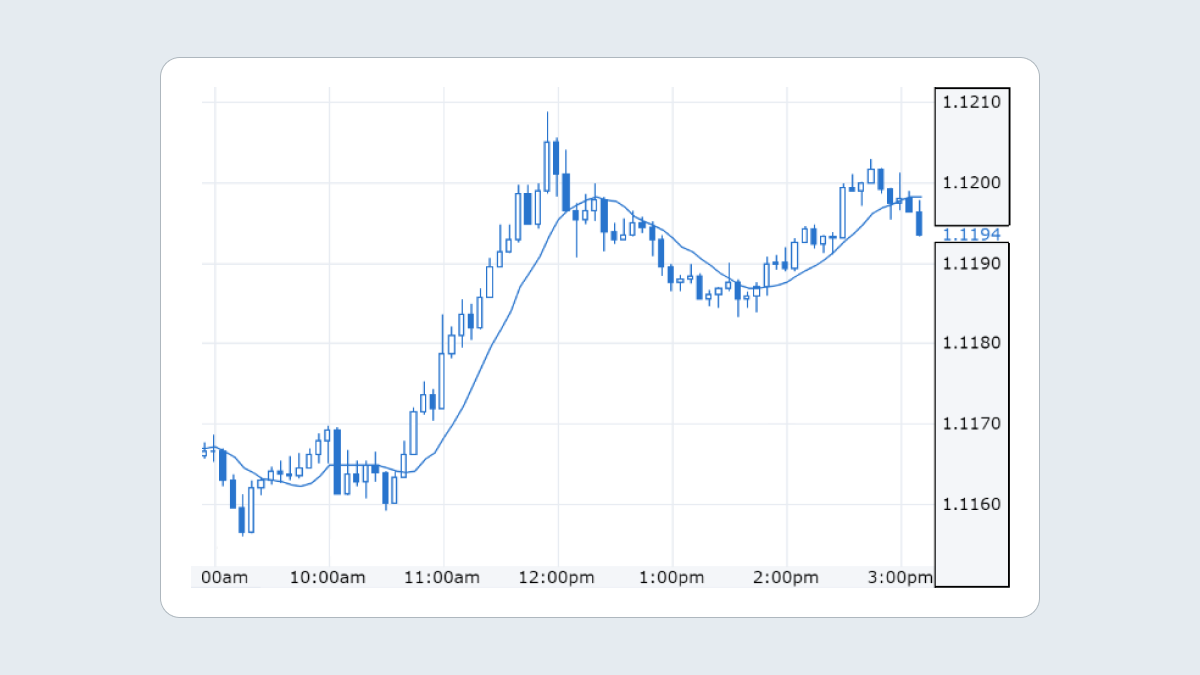
Forex is an online market where traders exchange one currency for another based on the rates set by the largest global over-the-counter participants. The market is so liquid and global that it doesn’t rely on specific stock exchanges.
Trading currency online is faster and more cost-effective than using local exchange services. At the same time, the amounts involved are much larger, which is why the forex market has the highest trading volume in the world. In fact, the daily trading volume on forex is far greater than the combined value of all global stock markets or the market for metals like gold.
Let’s turn to the meaning of the term:
Forex (FOREX) stands for foreign exchange, which refers to the exchange of foreign currencies.
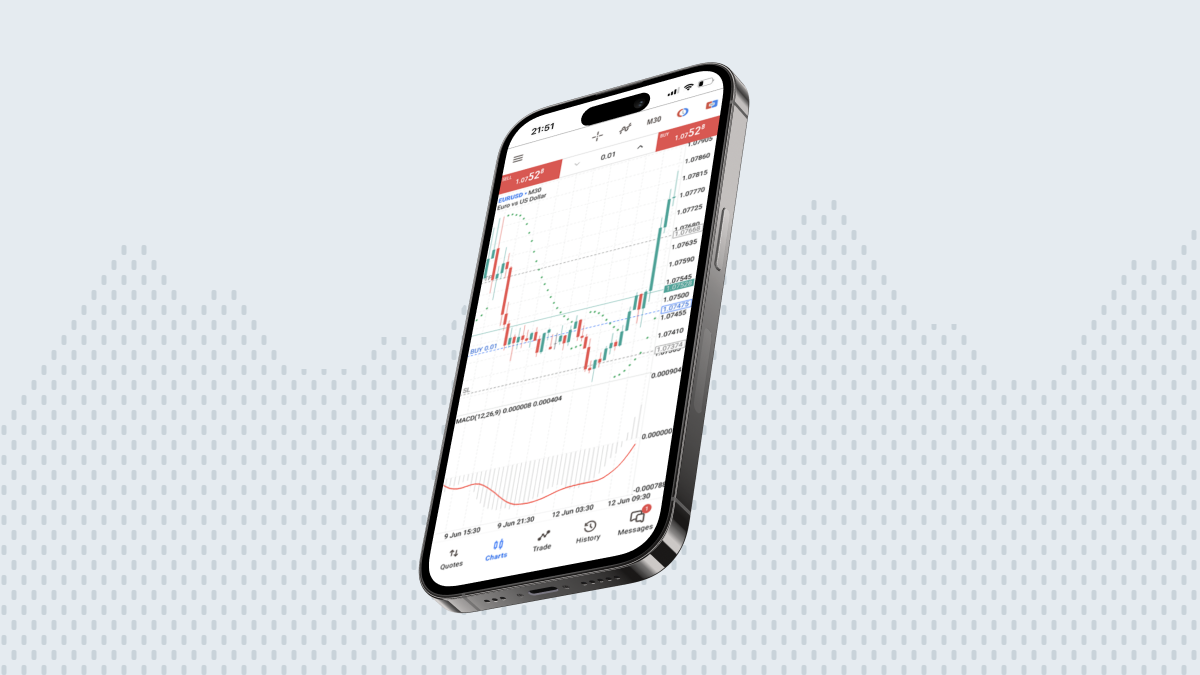
This market allows you to start trading foreign currencies within seconds, as it operates 24 hours a day, 5 days a week, with a massive trading volume. Currency fluctuations are much smaller compared to the stock market. These features make it possible for brokers to offer margin trading to their clients. This means you can open positions much larger than your current financial capacity. To do this, brokers like FBS provide leverage.
Forex is a global currency market, the largest in terms of trading volumes and income, that revolves around speculating on the price differences between currency pairs. On the foreign exchange, traders can profit from both the rise and fall of currencies.