
The first step to start trading is to download MetaTrader 4 or MetaTrader 5 trading platform and install it on your device.
- Download MetaTrader 5 for Android
- Download MetaTrader 5 for iOS
- Download MetaTrader 5 for other platforms
Next step is to log in to your trading account. To do it, please check this article: How to log in to my trading account.
Once you are logged in, you're ready to start your first trade.
How to open an order (position) in a mobile application
There are several ways to open a trading order:
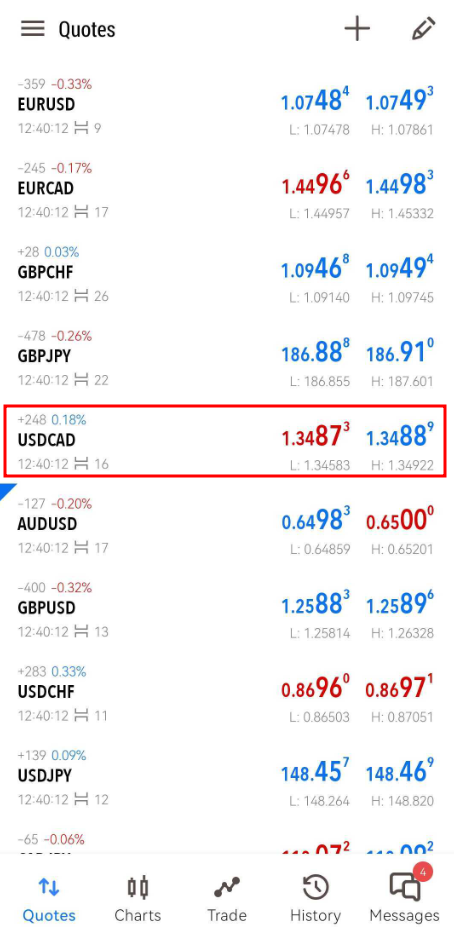
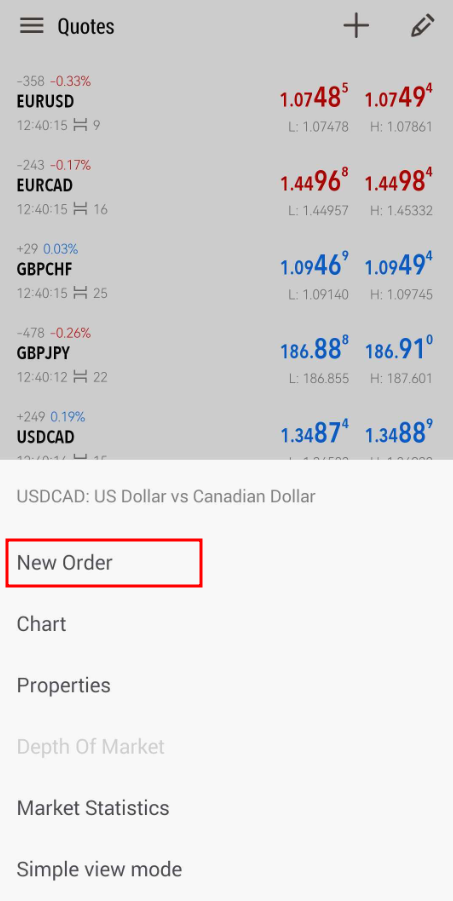
Click on the pair you want to trade in the Quotes tab -> Click New order (on Android) / Trade (on iOS).
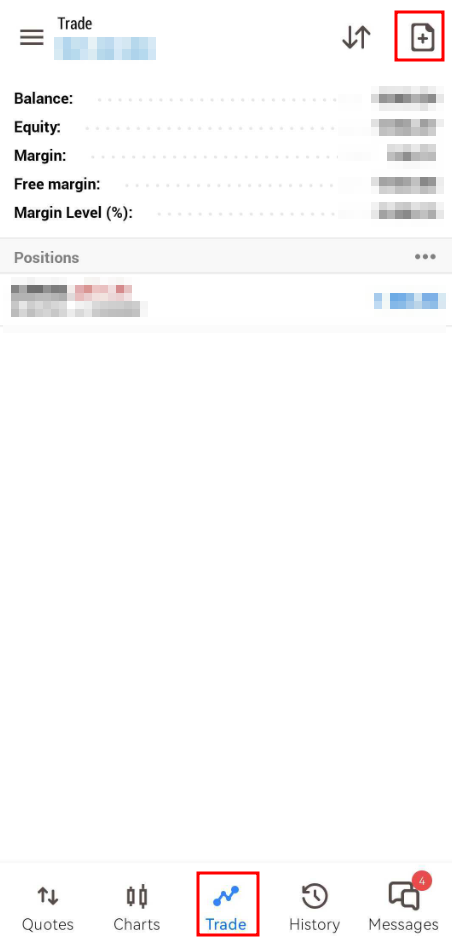
Open the Trade section and click on the New order button in the top right corner.
Once you follow the instructions, you will see the order opening page, which looks like this:
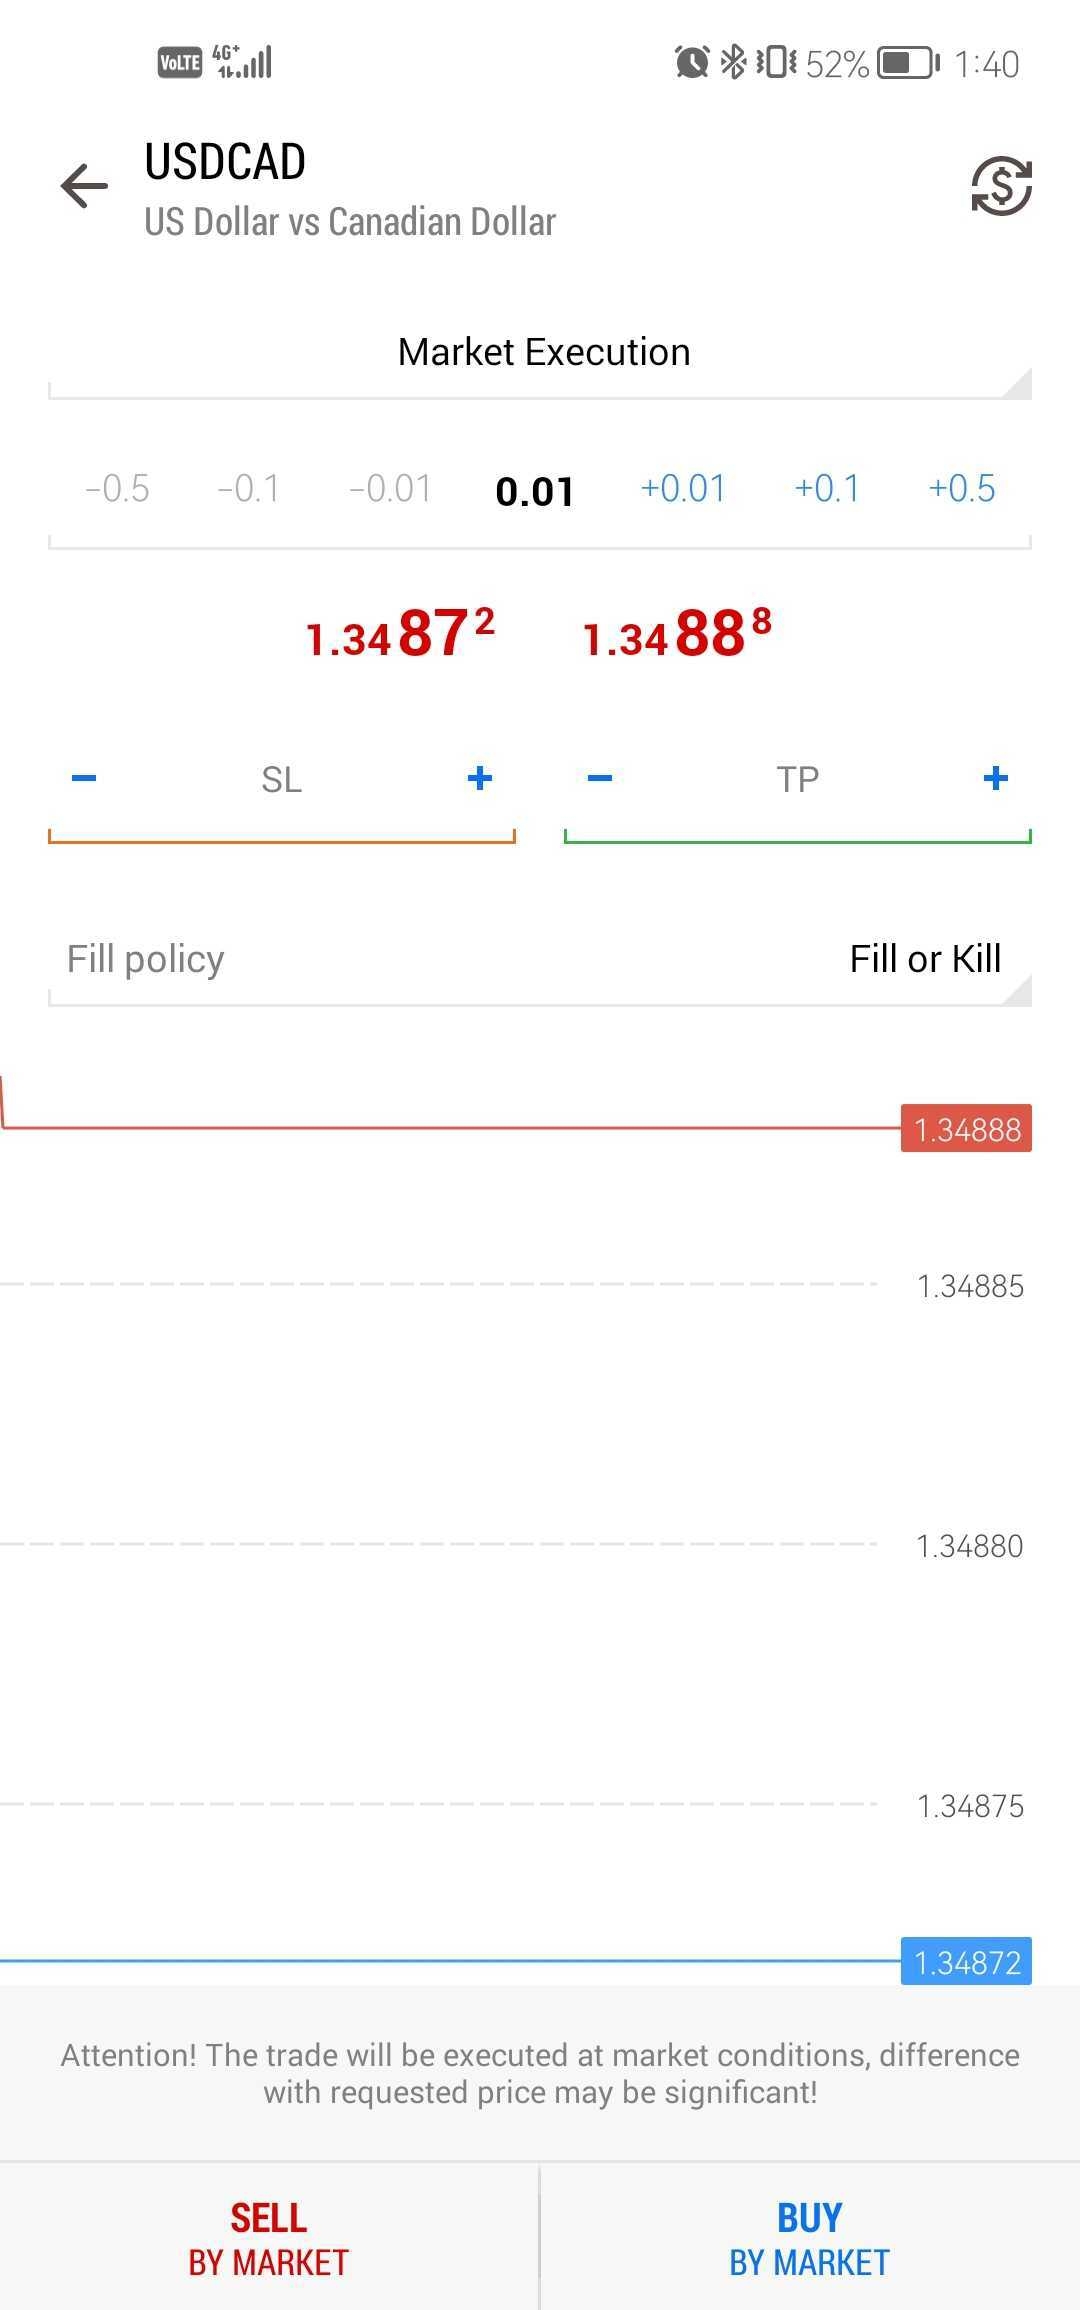
When opening a position, it is necessary to fill in the following fields:
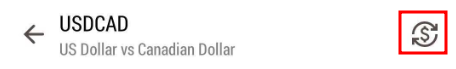
- Symbol – choose the instrument for trading.You can select the instrument by clicking on this icon
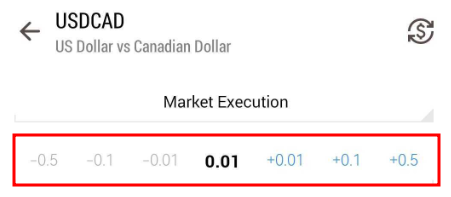
- Volume – set the volume of the order (number of lots).To modify the order volume, use these buttons or type the number:
You can also use the following fields, but they are not mandatory:
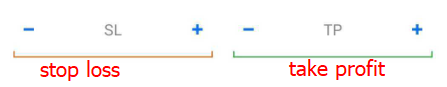
- Stop Loss – set the Stop Loss level. If it is 0.000, it is considered that the order is not placed.
- Take Profit – set the Take Profit level. If it is 0.000, it is considered that the order is not placed.
Attention! If Stop Loss and Take Profit levels were set too close to the current price, you will see an error message: Incorrect S/L or T/P. You will need to move the levels farther from the current price and repeat the request.
One-click trading
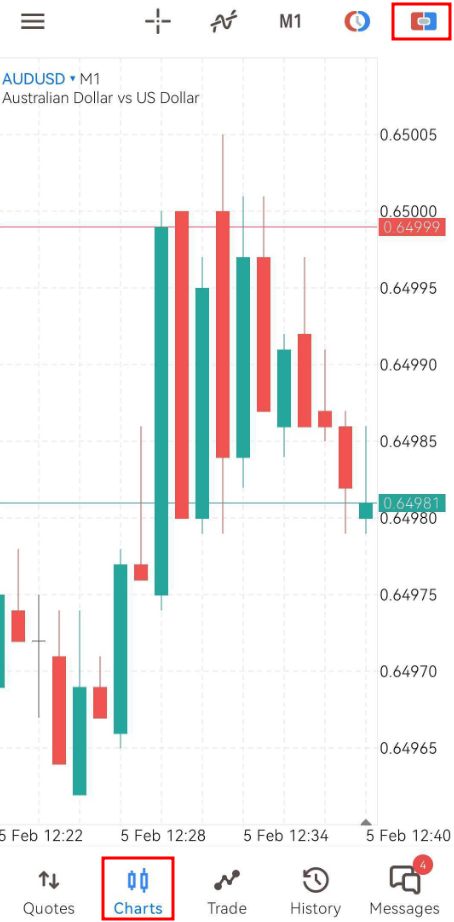
To open your trade faster, you can use the One-click trading option directly on the chart window. You need to open a chart for the instrument you want to trade and click on the One-click trading button to enable this option.
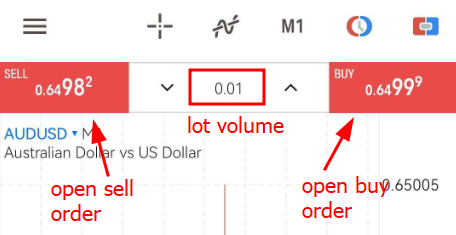
Once you click on it, you will see the one-click trading panel appear:
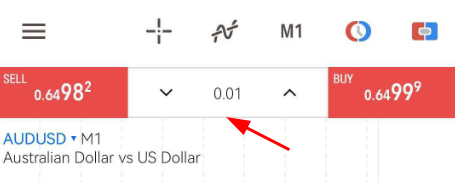
Then, you will be able to use this panel to open your trades. Modify your lot volume and click on SELL or BUY button to open a respective trade.
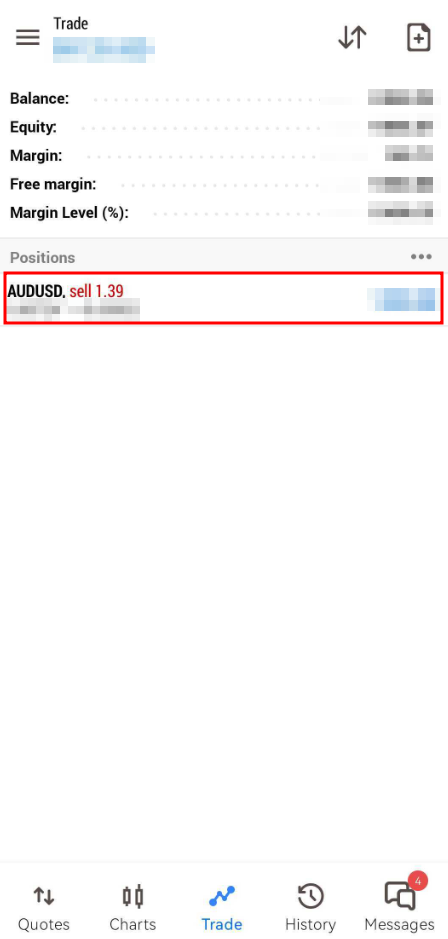
Closing of a position
To close a position, please open a Trade section, then click and hold the order in question.
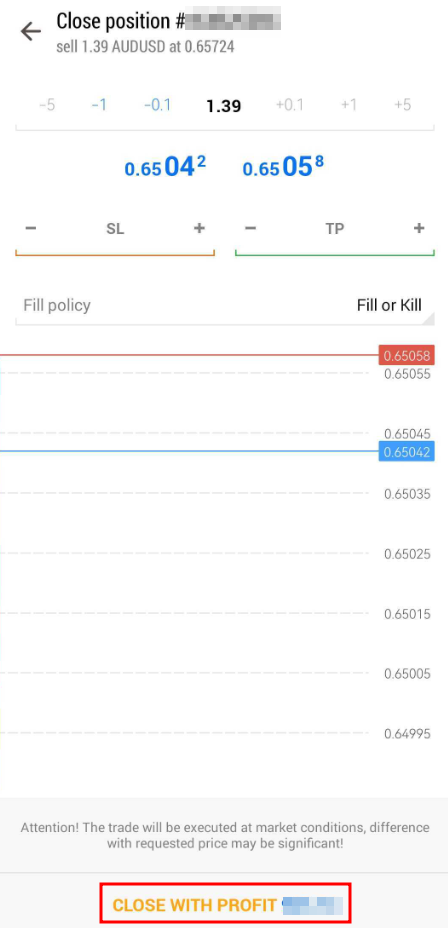
In the pop-up window, please select Close position:
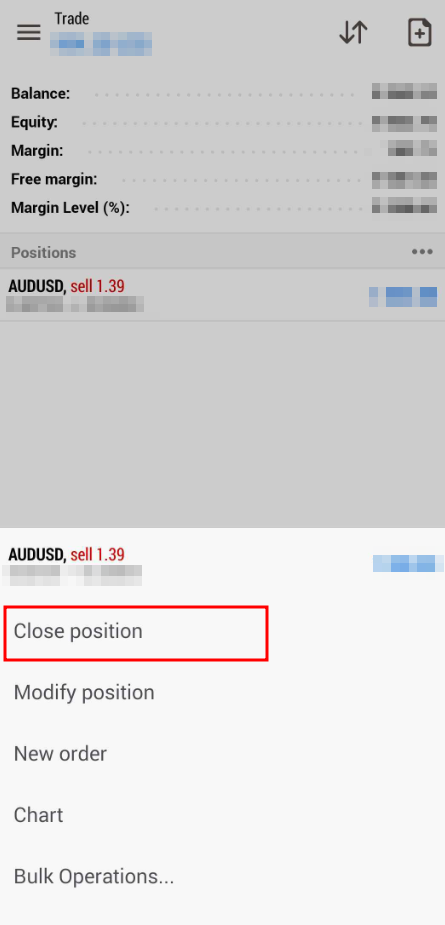
Then confirm the closure by clicking on the Close with profit/loss button:
The order with the set levels of Take Profit and/or Stop Loss will close automatically when the price reaches the chosen Take Profit or Stop Loss. A Long position is closed at the Bid price, a Short position – at the Ask price.
Access to the FBS MetaTrader course on our website.
Also, we recommend you to read our Forex Guidebook for more useful information about trading.
How to open an order (position) on PC
There are several ways to open a trading order:
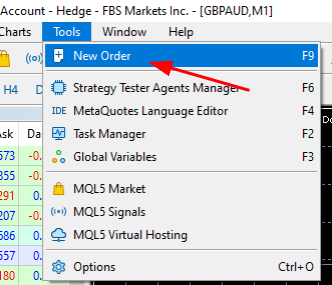
Choose “Tools” → “New order” in the program menu.
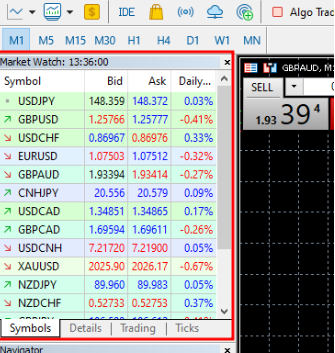
Double-click on the name of the trading instrument in the Market Watch window.
Click on the New Order button on the toolbar.

Press the F9 key on the keyboard.
Once you follow the instructions, you will see the order opening window, which looks like this:
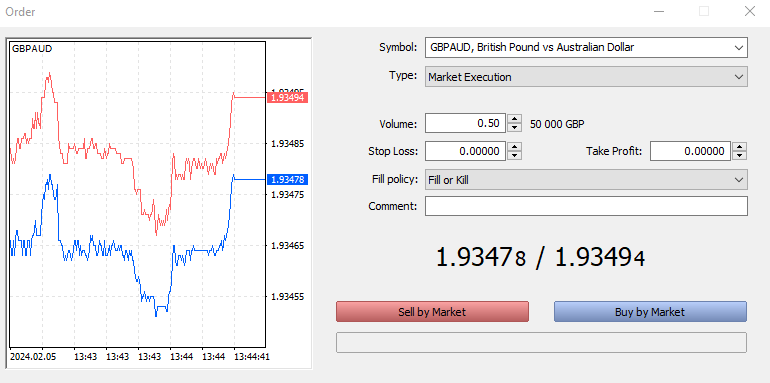
When opening a position, it is necessary to fill in the following fields:
- Symbol — choose the instrument for trading.
- Volume — set the volume of the order (number of lots).
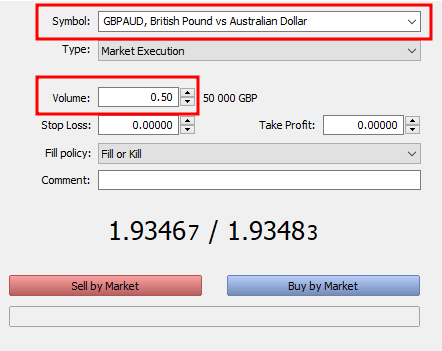
You can also use the following fields, but they are not obligatory:
- Stop Loss – set the Stop Loss level. If it is 0.000, it is considered that the order is not placed.
- Take Profit – set the Take Profit level. If it is 0.000, it is considered that the order is not placed
Attention! If Stop Loss and Take Profit levels were set too close to the current price, you will see an error message: Incorrect S/L or T/P. You will need to move the levels farther from the current price and repeat the request.
One-click trading
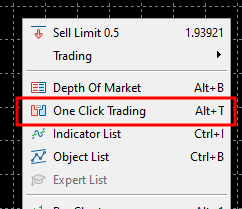
To open your trade faster, you can use the One-click trading option directly on the chart window. You need to open a chart for the instrument you want to trade, right-click on the chart and select One-click trading, or press Alt+T on your keyboard:
Once you click on it, you will see the one-click trading panel appear:
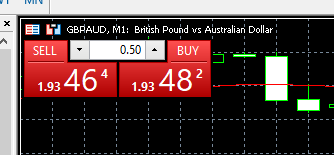
Then, you will be able to use this panel to open your trades. Modify your lot volume and click on SELL or BUY button to open a respective trade.
Closing of a position
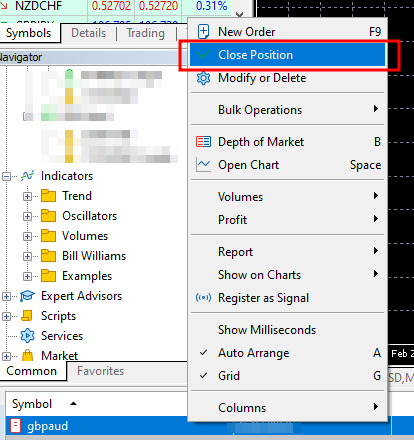
To close a position, please, right-click on the order in the Trade area below the chart and choose Close Position on the menu.
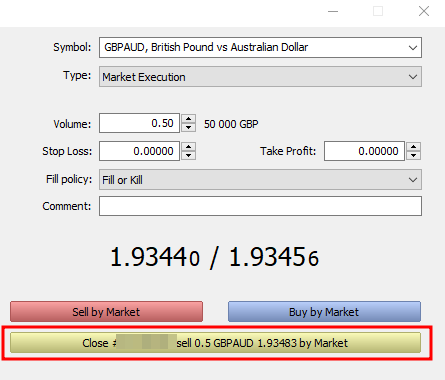
Another way to close the order is to double-click on it in the Trade area, then click on the yellow Close order button to confirm:
The order with the set levels of Take Profit and/or Stop Loss will close automatically when the price reaches the chosen Take Profit or Stop Loss. A Long position is closed at the Bid price, a Short position – at the Ask price.
Access to the FBS MetaTrader course on our website.
Also, we recommend you to read our Forex Guidebook for more useful information about trading.