STOCKS: to buy or not to buy
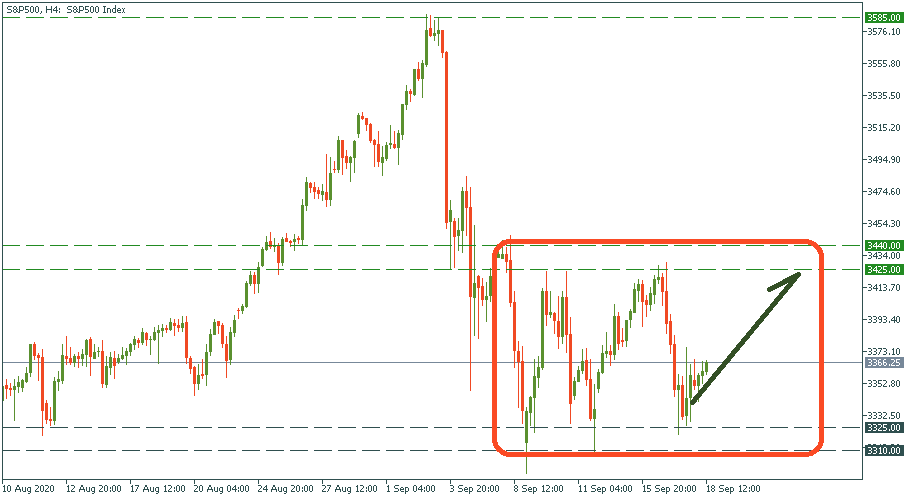
S&P: three bottoms
S&P dropped from the heights of 3 585 at the beginning of the month for “accusations” of being too optimistic and overheated. Since then, it has been bouncing between 3 325 and 3 425 in a sideways movement. Currently, it’s in the course of the third bounce upwards. Despite fears of dipping further below the support channel of 3 310 – 3 325, so far the technical panorama suggests that it will go up to the resistance range of 3 425 – 3 440. If we look at specific stocks, though, indeed they trade differently. Which of them is worth buying now? Those which are at the local lowest lows. So let’s find them.
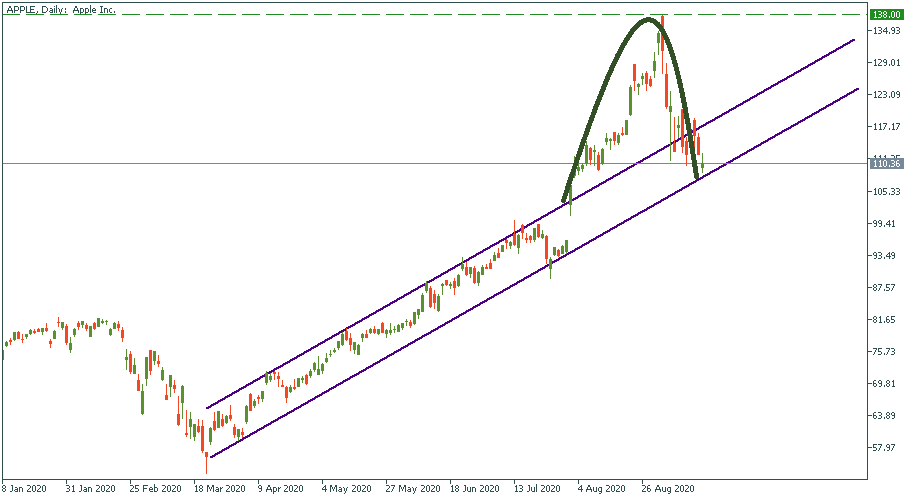
Apple: back to normal
Like the rest of the stock market, Apple fell from 138 to the current 110. The yearly event they had on September 15 did not spark any bullish activity – if not increased the gravity to the downside. There are observers who comment that Apple may be not the best stock to buy. But from the technical perspective, there may hardly be a better moment in the nearest future. The surge Apple had in August may be seen as a deviation from the main upward channel it has been in since March. Now, it is back right into this channel, and unless it breaks away from it into lower ranges of below 100, you may well assume it is up for a rise.
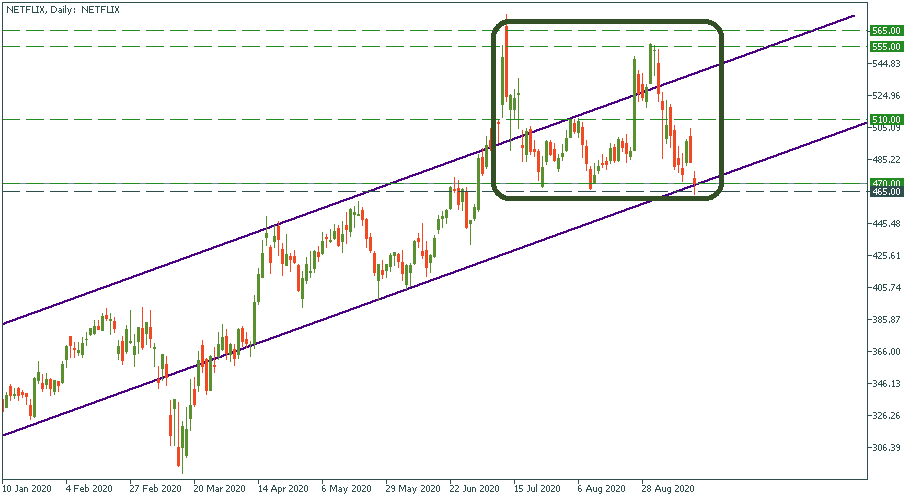
Netflix: flanked by borders
Using the same technique with Netflix, we will see that its share price is now right at the bottom of the major channel it has been going through – even long before the virus came. Also, we see two clear zones: the resistance range of 555 – 565 which saw the price bounce downwards twice, and the support channel of 465 – 470, where the price is right now and which will probably see it go upwards again pretty soon. Intermediary resistance of 510 will be the checkpoint to confirm that the price is likely to continue the upward march once it is there. Wait for reversal though – as beautiful as it seems, the idea of a bullish reversal at 470 needs to be fact-checked first.
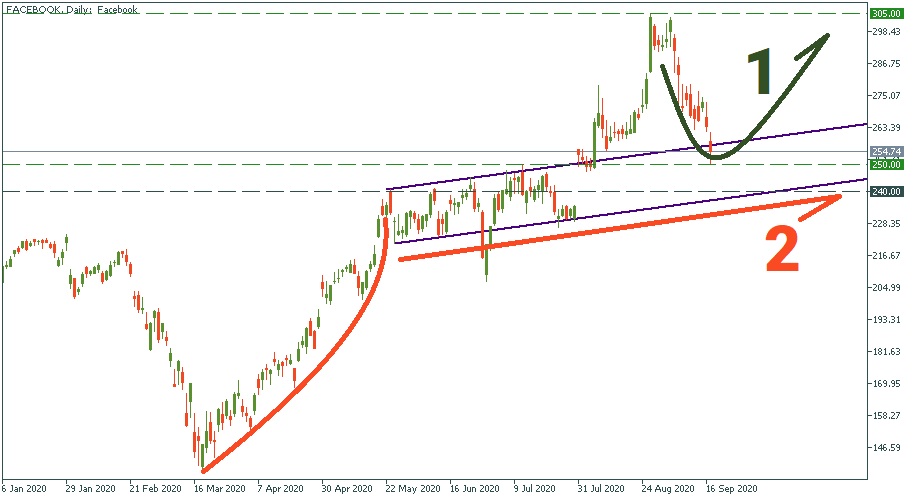
Facebook: two alternatives
Just for a change, Facebook offers an interesting layout. When it started the recovery in March, it took quite an aggressive vertical trajectory. In May, it slowed down the growth stabilizing around 240 and going in a linear trajectory as in the chart below. In August, it went all-in again to reach 305 and fell from there to the current 250. Now, there are two alternatives: either this stock will drop even further to get back to that linear equilateral channel to bottom at 240 and get up, or it will bottom out at 250 and reverse to take a more aggressive march upwards. Therefore, watch for reversal signs, and check the channels.