
هل يمكن تجنب الركود؟
لا يزال الوباء يضر بالنشاط الاقتصادي في الصين، وتضرب الحرب في أوكرانيا الاقتصاد الأوروبي بأكمله، وتهدد جهود الاحتياطي الفيدرالي للسيطرة على التضخم بحدوث ركود.
لا يزال الوباء يضر بالنشاط الاقتصادي في الصين، وتضرب الحرب في أوكرانيا الاقتصاد الأوروبي بأكمله، وتهدد جهود الاحتياطي الفيدرالي للسيطرة على التضخم بحدوث ركود.

التضخم في اليابا ينصل أخيرًا إلى 2% في قراءة إبريل المقبلة، لكن ماذا عن الين الضعيف؟

ارتد الدولار الأمريكي من مستوى مقاومة هام يوم الجمعة، بينما اكتسب الذهب قوة. ستتأثر العملات الرئيسية هذا الأسبوع بقرار سعر الفائدة الصادر عن مجلس الاحتياطي الفيدرالي، و NFP، واجتماع بنك إنجلترا، والمزيد من الأحداث. كما سيقود موسم الأرباح سوق الأسهم. شاهد الفيديو للحصول على الأفكار!
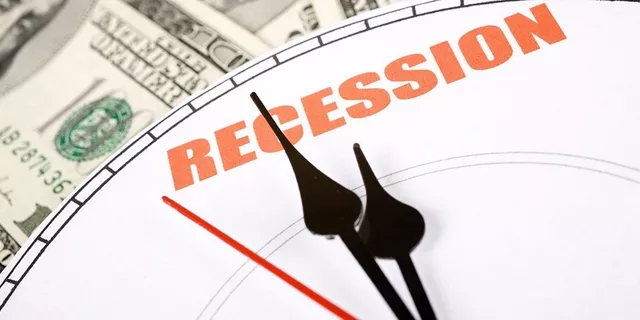
كلما تجاوز التضخم نسبة 4٪، وهبطت البطالة إلى أقل من 5٪، دخل الاقتصاد الأمريكي في حالة ركود خلال عامين.

لماذا يتوقع تباطؤ الأسواق الأمريكية؟ وماذا عن نتائج أرباح شركات التكنولوجيا والتي على رأس أحداث هذا الأسبوع؟

البنك المركزي الأوروبي التيسيري والفيدرالي المتشدد يرسمان اتجاه هبوطي لليورو/دولار. فهل الهبوط إلى 1.0770 هو المحطة التالية؟

بعد بيانات التضخم الأمريكية التي صدّرت اليوم، والتي بينت زيادة بالتضخم ووصله لمستويات 8…

أثار تحرك الولايات المتحدة وحلفائها الغربيين لتجميد احتياطيات روسيا من العملات الأجنبية مخاوف مخاوف من استخدام الدولار الأمريكي كسلاح. وقد يؤدي ذلك إلى تدمير هيمنة الدولار.

حقق الدولار بداية قوية للأسبوع حيث ارتفعت عوائد سندات الخزانة مع توقعات برفع سريع لأسعار الفائدة الأمريكية، في حين أبقى الحديث عن حظر أوروبا للغاز الروسي غطاءً على اليورو، والدولار يتداول الآن عند مستويات 98…

ماذا سيحدّث؟! يستحوذ على اهتمام جمّوع المتداولين في الغد، بيانات تقرير الوظائف الأمريكية الصادر عن مكتب الولايات المتحدة لإحصائيات العمل، وهى تعتبر أول بيانات لتقرير الوظائف بعد الحرب الروسية الأوكرانية، وعلى الرغم من أن الاقتصاديين يقولون أنه من غير…

الين الياباني يهبط إلى أدنى مستوياته أمام الدولار الأمريكي منذ عام 2015. اليابان وأمريكا مختلفان في كل شيء، بينما تسير الولايات المتحدة نحو التشديد، اليابان مستمرة في التيسير. ويصل الاختلاف حتى أسعار الفائدة والتضخم.

منذ أزمة كوفيد 19 وأرقام التضخم تزداد بشكل مستمر دون توقف، بل وتخطت أهداف الفيدرالي التي كانت دائماً أقل من 2% ثم بعد ذلك وُصف هذا الهدف أنه متوسط، ليُضيف مساحة أخرى من صعود التضخم دون قلق ولكن هذا الأمر أصبح من الماضي بعد ان استمرت أرقام التضخم بالتزايد…
تحتفظ FBS بسجل لبياناتك لتشغيل هذا الموقع الإلكتروني. بالضغط على زر "أوافق", فأنت توافق على سياسة الخصوصية الخاصة بنا.
لقد تم قبول طلبك
الموظف سيتكلم معك قريبا
يمكنك طلب إعادة الاتصال بهذا الرقم مجددا
خلال
إذا كانت لديك أية مسألة طارئة، يرجى التواصل معنا عبر
الدردشة الحية
خطأ داخلي. الرجاء المحاولة لاحقا
لا تضيع وقتك - تتبع تقرير الوظائف غير الزراعية وتأثيره على الدولار الأمريكي لتتمكن من تحقيق الأرباح!
|


