Fundamental Analysis
The U.S. CPI report for September revealed figures slightly above market expectations. Headline inflation (CPI) stood at 2.4% year-over-year, down from 2.5% in August but above the forecast of 2.3%, indicating a mild deceleration compared to the previous month, although not as significant as anticipated. This reflects that while prices have decreased relative to August, the pace of reduction is slower than projected.
Core CPI, which excludes food and energy, rose 3.3% in September, surpassing both the forecast of 3.2% and the August figure (also 3.2%). This increase suggests that underlying inflationary pressures remain, which could complicate the Federal Reserve’s plans to lower interest rates. Additionally, jobless claims unexpectedly rose to 258,000, much higher than the 231,000 forecast, possibly indicating a weakening labour market.
Today, the U.S. Q3 earnings season begins, which could provide an additional boost to this tech-heavy index.
Technical Analysis
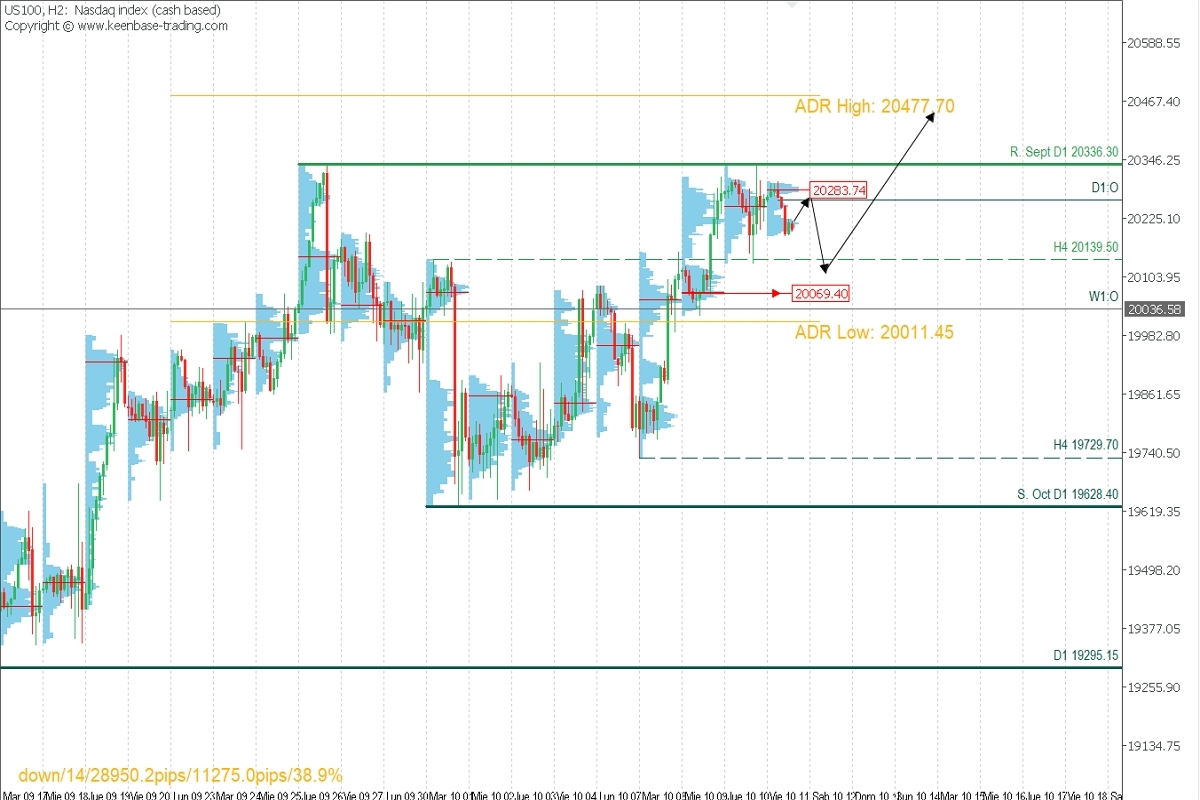
US100, H2

- Supply Zones (Sell): 20283.74
- Demand Zones (Buy): 20069.40
The consolidation below the September resistance is accumulating local volumes around 20283. If the price remains below this level, it is possible to target sales towards 20139 and 20100, from which liquidity can be acquired to resume buying and aim to surpass the September resistance at 20336.30, extending the rise toward the daily bullish range at 20477.70. The last validated intraday support for the bullish trend is at 19729.70.
Technical Summary
- Sell below 20283.74 with TP at 20140 and 20100 as an extension. Use a 1% stop-loss of your capital.
- Buy after the pullback, above 20100 with TP at 20336 and 20477 as an extension. Use a 1% stop-loss of your capital with a low lot size to allow for movement.
Always wait for the formation and confirmation of an Exhaustion/Reversal Pattern (ERP) on M5 like those we teach here: https://t.me/spanishfbs/2258 before entering a trade in the key zones indicated.
*POC (Point of Control): This is the level or zone where the highest volume concentration occurred. If a bearish move occurred from this level, it is considered a sell zone, forming resistance. Conversely, if an upward move occurred, it is considered a buy zone, usually located at lows, forming support zones.
@2x.png?quality=90)


