USDCAD, Daily
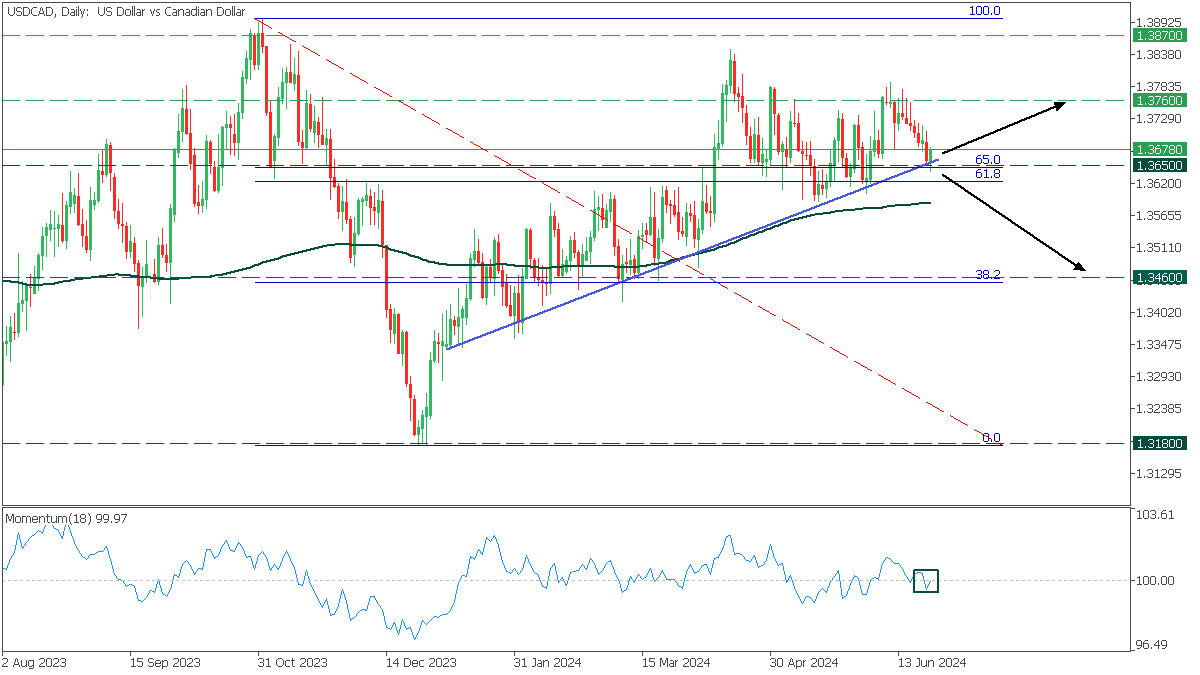
On the Daily chart, USDCAD is navigating within an uptrend and facing a crucial 1.3650 support zone, aligned with the golden Fibonacci ratio. The Momentum Oscillator crosses the 100 level from above, potentially signaling a bearish sentiment.
- If the price rebounds from the support zone, it will likely lead to a rise toward 1.3760
- However, breaching below the trendline will indicate a decline to 1.3460 support.