USDJPY, H4
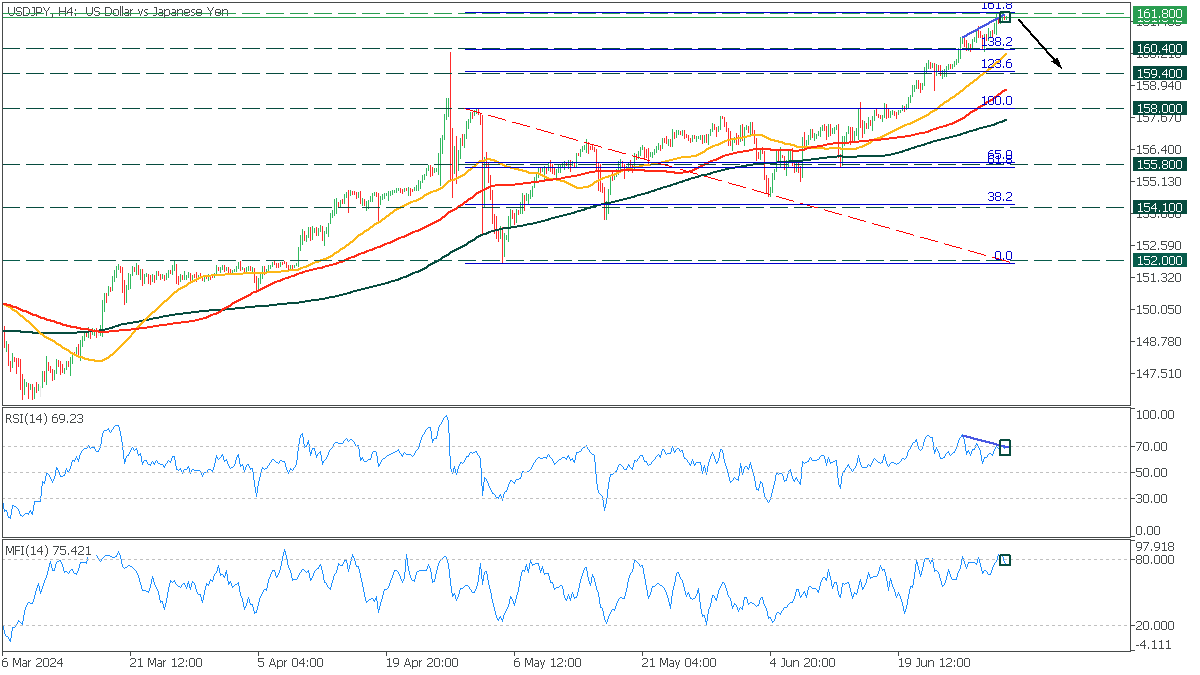
On the H4 chart, USDJPY is approaching the critical resistance zone at 161.80, aligned with the 161.8 Fibonacci ratio. The RSI shows a bearish divergence with the asset, while the MFI indicates overbought conditions.
- Trade: Sell USDJPY;
- TP1: 160.40;
- TP2: 159.40.
Trading foreign currencies on margin involves significant risks and may not be suitable for everyone, as high leverage can increase both potential gains and losses. Before entering the foreign exchange market, it is essential to evaluate your investment goals, personal experience, and risk tolerance.

Author: Timur Yurdagyul