XNGUSD, H4
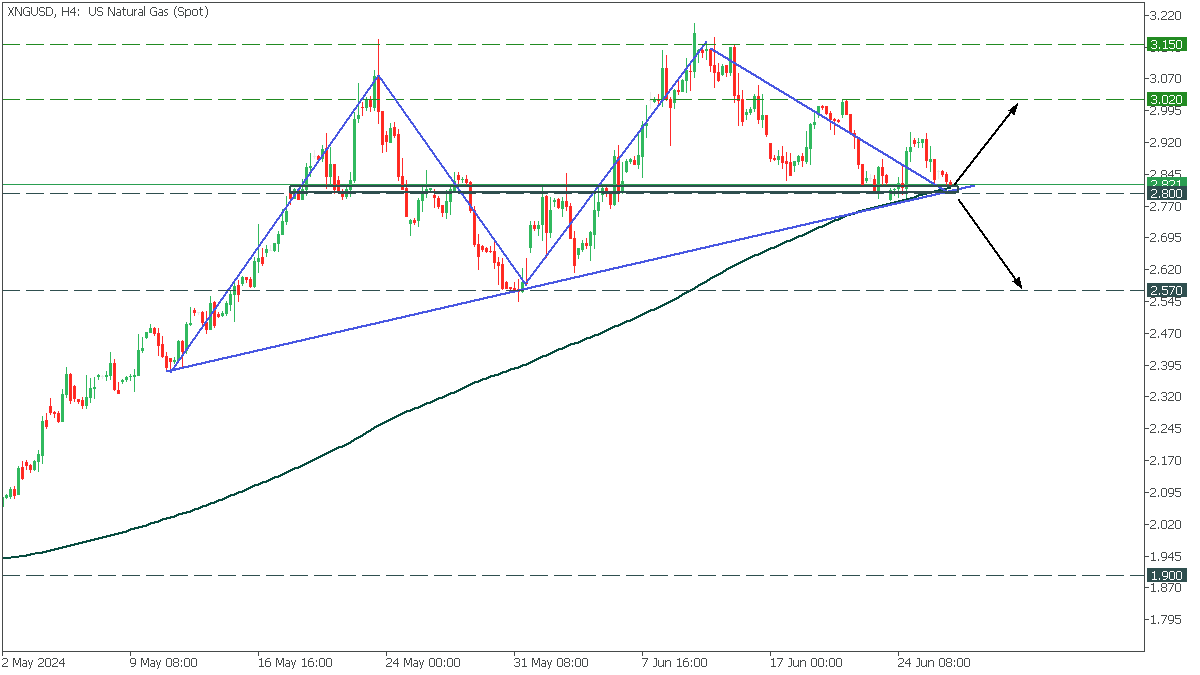
On the H4, XNGUSD formed a double-top pattern in a long-term uptrend. The price fell to the neckline, testing the critical support and MA200. Despite the bearish pattern, the overall trend is bullish, so it is vital to consider two scenarios.
- If the price breaks the support at 2.800 and MA200, the bearish scenario will start up to 2.570;
- However, if XNGUSD bounces off the support, it will rise to 3.020;