Bat
The Bat pattern is a variation of the harmonic pattern Gartley pattern. The outlines of these patterns are the same, the difference is in Fibonacci ratios that define the positions of the main points.
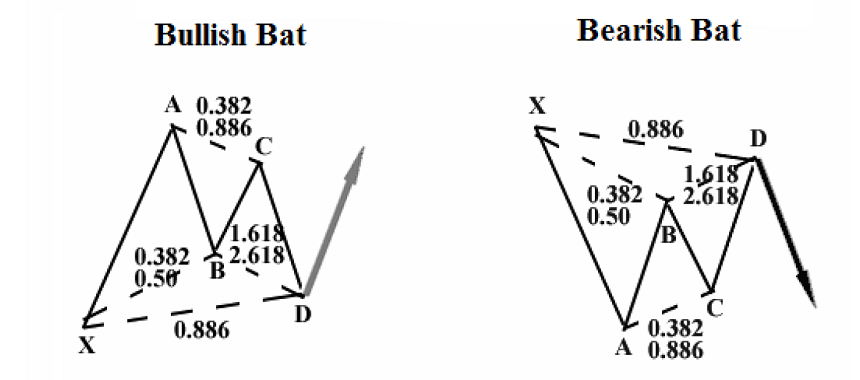
Let’s have a look at the parameters of a Bat pattern:
- Point B is at the 38.2-50% retracement of XA.
- Point C can be at the 38.2%-88.6% retracement of AB.
- Point D can be found at the 161.8%-261.8% extension of AB or at the 88.6% retracement of XA.
How to trade bat pattern
- The entry is at point D. As usual, confirmation of the market’s reversal is necessary.
- Take Profit may be at 61.8% of CD (TP1), 127.2% of CD (TP2), and/or the projection of XA from D (TP3).
- Put a Stop Loss in line with your rules of risk management.
Let's have a look at the example of the bullish Bat pattern on the chart.
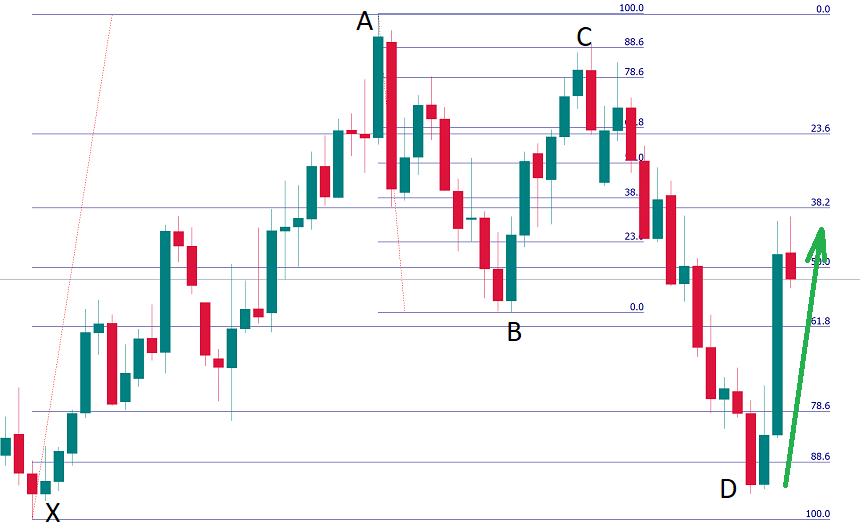
You can see that point B is at about the 61.8% retracement of XA, point C is at the 88.6% retracement of AB, while point D is near the 88.6% retracement of XA. The Fibo ratios are not exactly the same as in the scheme, but they are close enough. Notice that a "harami" candlestick pattern was formed at point D confirming the price's reversal to the upside.
Start Trading2022-05-17 • Updated
Other articles in this section
- Structure of a Trading Robot
- Building a Trading Robot without Programming
- How to Launch Trading Robots in MetaTrader 5?
- Algorithmic Trading: What Is It?
- Fibonacci Ratios and Impulse Waves
- Guidelines of Alternation
- What is a triangle?
- Double Three and Triple Three patterns
- Double Zigzag
- Zig Zag and Flat Patterns in Trading
- Advanced techniques of position sizing
- Truncation in the Elliott Wave Theory
- Ichimoku
- What is an extension?
- Ending Diagonal Pattern
- How to trade gaps
- Leading diagonal pattern
- Wolfe waves pattern
- Three drives pattern
- Shark
- Butterfly
- Crab Pattern
- Gartley
- ABCD Pattern
- Harmonic patterns
- What is an impulse wave?
- Motive and corrective waves. Wave degrees
- Introduction to the Elliott Wave Theory
- How to trade breakouts
- Trading Forex news
- How to place a Take Profit order?
- Risk management
- How to place a Stop Loss order?
- Technical indicators: trading divergences